SaraFluor™ Structural Imaging Series

SaraFluor™ 488B, 650B

[Fluorophores for superresolution imaging]

495-540 nm:Green

650-750 nm:Far red

The theoretical limit of the resolution of fluorescence microscopy imaging is about half of the light wavelength (200-400 nm). A number of new imaging methods called “superresolution fluorescence microscopy” exceeding this limitation have been developed. One of them, called single molecule localization microscopy (SMLM), is widely used. Developed exclusively for SMLM, SaraFluor B series* is a fluorescent probe that exhibits spontaneous blinking under physiological conditions.

SaraFluor 488B (SF488B, HEtetTFER) is a green fluorecence dye excited by a blue laser.
SaraFluor 650B (SF650B, HMSiR) emits deep red fluorescence with red laser excitation.

*SaraFluor is named after an Ainu language word “sara” which means “become visible” or “spacious and bright wetland”. Probes which exhibit spontaneous blinking are marked with letter B of “blinking”.
** These products are the same as those sold under the name of HMSiR-Halo.

Products

Code No. Product Name Size Merck CAT No. Merck ( Millipore / Sigma Aldrich )
Product Name
A208-01 SaraFluor™ 650B-NHS 100 μg
A209-01 SaraFluor™ 650B-maleimide 100 μg
A218-01 SaraFluor™ 488B-NHS 100 μg

Downloads

  • A208 SaraFluor650B-NHS protocol

  • A218 SaraFluor488B-NHS protocol

  • Flyer

  • A208 SDS

  • A209 SDS

  • A218 SDS

  • Product Information

    Print

    Properties of SaraFluor B

    Product Name Absmax (nm) FLmax (nm) ε Φ
    SaraFluor 488B (HEtetTFER) 507 530 80,000 0.76
    SaraFluor 650B (HMSiR) 654 669 100,000 0.39

    Blinking properties of SaraFluor B

    Spontaneous blinking of SaraFluor B in PBS (pH 7.4). Measured intensity change in a region corresponding to one molecule from a fluorescence image obtained by total internal reflection fluorescence microscopy with 647 nm laser excitation for SaraFluor 650B (HMSiR), or with 488 nm laser excitation for SaraFluor 488B (HEtetTFER). (It is impossible to compare two vertical axes because different optical measurement systems were used.)

    Spectra of SaraFluor B


  • Images using SaraFluor 488B

    Print

    Images using SaraFluor 488B

    Conventional fluorescence and SMLM images of fixed A549 cell stained with anti-α-tubulin antibodies (DM1A 1/4000 dilution) and SaraFluor 488B labeled secondary antibody. The total internal reflection fluorescence microscopy images were taken using NIKON Ti, NIKON Apo TIRF100x (NA 1.49) and ImagEM (Hamamatsu Photonics) with 488 nm laser excitation at the Nikon Imaging Center at Hokkaido University. The SMLM image was processed using ImageJ and ThunderSTORM.


  • Images using SaraFluor 650B antibody

    Print

    Images using SaraFluor 650B antibody

    An enlarged image of a HeLa cell pseudopod. Cells were fixed and stained with an anti-α-tubulin antibody (DM1A, 1/4000 dilution) and SaraFluor 650B (HMSiR) labeled secondary antibody (A202-01, 30 μg/mL). Left image (Conventional fluorescence image) is produced by averaging 25,000 images taken by the Nikon super-resolution microscope system (N-STORM) using NIKON Apo TIRF 100x (NA1.49) with 647nm laser excitation; right images are super-resolution images obtained by processing 1,000 and 25,000 images with ImageJ/ThunderSTORM software (SMLM).


  • Three-dimentional imaging microtubules using SaraFluor B with 3D-STORM

    Print

    Three-dimentional imaging microtubules using 3D-STORM

    SaraFluor B is a series of fluorophorea which show spontaneous blinking in physiological buffer conditions. By using NIKON N-STORM system with cylindrical lens, SaraFluor-B-stained three-dimentional structures cab be observed in super-resolution.


    Microtubule structure of a HeLa cell stained with SaraFluor 650B labeled goat anti-mouse IgG

    3D structure of microtubules imaged using cylindrical lens. Resolution in Z-axis of about 50 nm was obtained. Imaged in a N-STORM microscope in The Core Laboratories, The Institute of Medical Science, The University of Tokyo.

    Procedures

    1. HeLa cells cultured on a glass-bottomed dish was fixed in 3% paraformaldehyde for 20 minutes at 37℃.
    2. Rinsed with PBS
    3. Membrane-permeabilization in cold methanol for 5 minutes at -20℃.
    4. Blocking in PBS containing 5% BSA  for 30 minutes. Rinsed three times.
    5. Reacted with primary antibody.  Purified anti-Tubulin-α Antibody  (625901, BioLegend)was diluted to 10 μg/mL with PBS, and reacted for 2 hours at room temperature. Then, rinsed with PBS for 3 times.
    6. Reacted with secondary antibody. SaraFluor 650B goat anti-mouse IgG was diluted to 10 μg/mL with PBS, and reacted for 2 hours at room temperature in dark, for 2 hours. Then, rinsed with PBS for 3 times.
    7. Observed using NIKON N-STORM system. Excited with 647- nm laser of 100 W/cm2 power. Cylindrical lens of the system was used to obtain images and 3D-STORM analysis was performed according to manufacture’s instructions.
  • Effect of frame numbers and analysis algorithms on SaraFluor B series superresolution images

    Print

    Effect of frame numbers and analysis algorithms on superresolution images

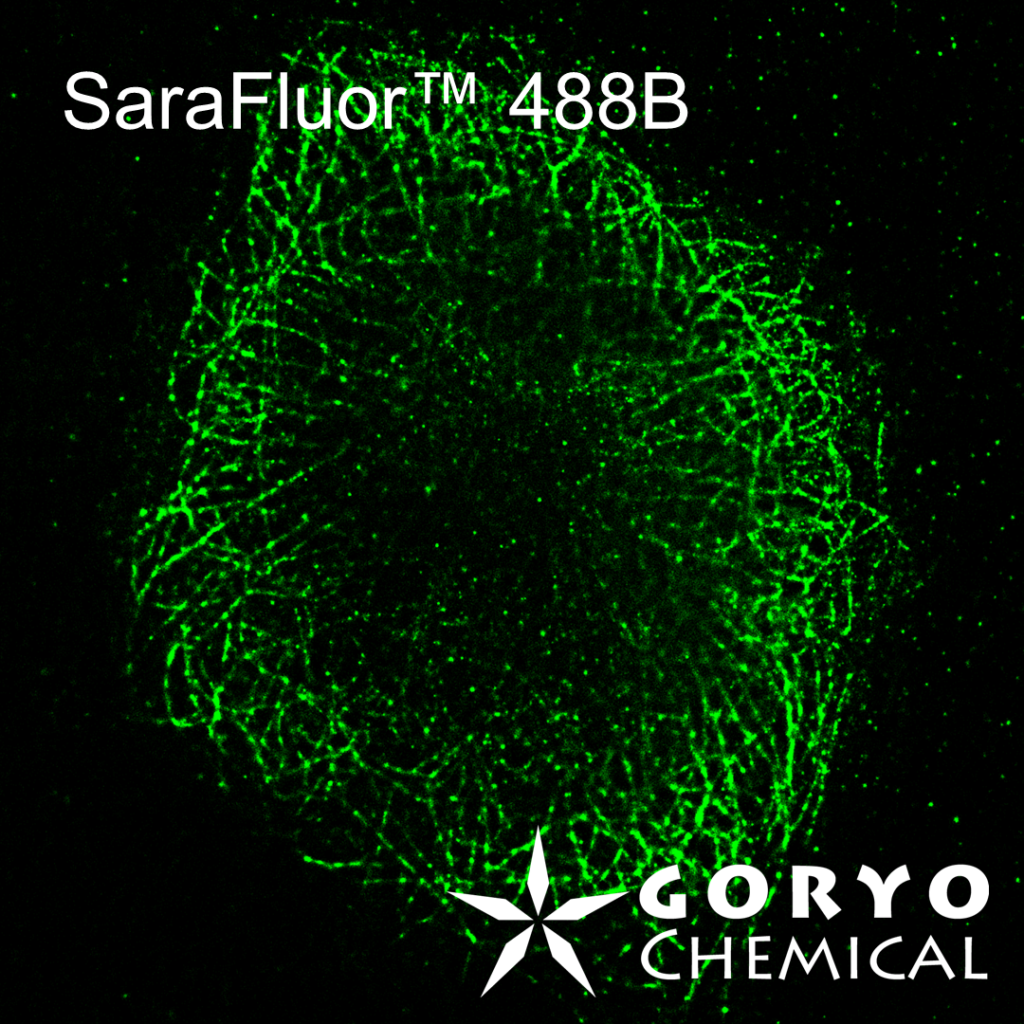
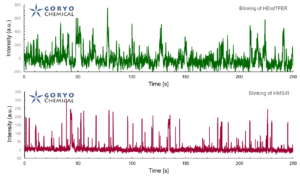
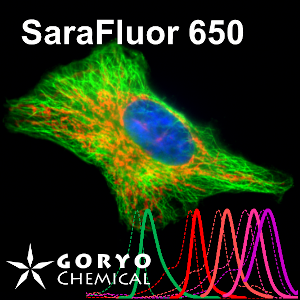
    SaraFluor B series is a line of fluorophores which show spontaneous blinking in physiological pH. Without a special microscope system for PALM/STORM, a microscope which can image single fluorophore can be used to get multiple images of SaraFluor B and these images can be converted to superresolution image by using ImageJ plugins.

    Besides a commonly used ImageJ plugin, ThunderSTORM,  TRM mode of NanoJ SRRF , a plugin for supreresolution image analysis, can be also used  to analyze SaraFluor B images to obtain superresolution images. Here, we qualitatively compare the effect of image numbers using these two plugins.


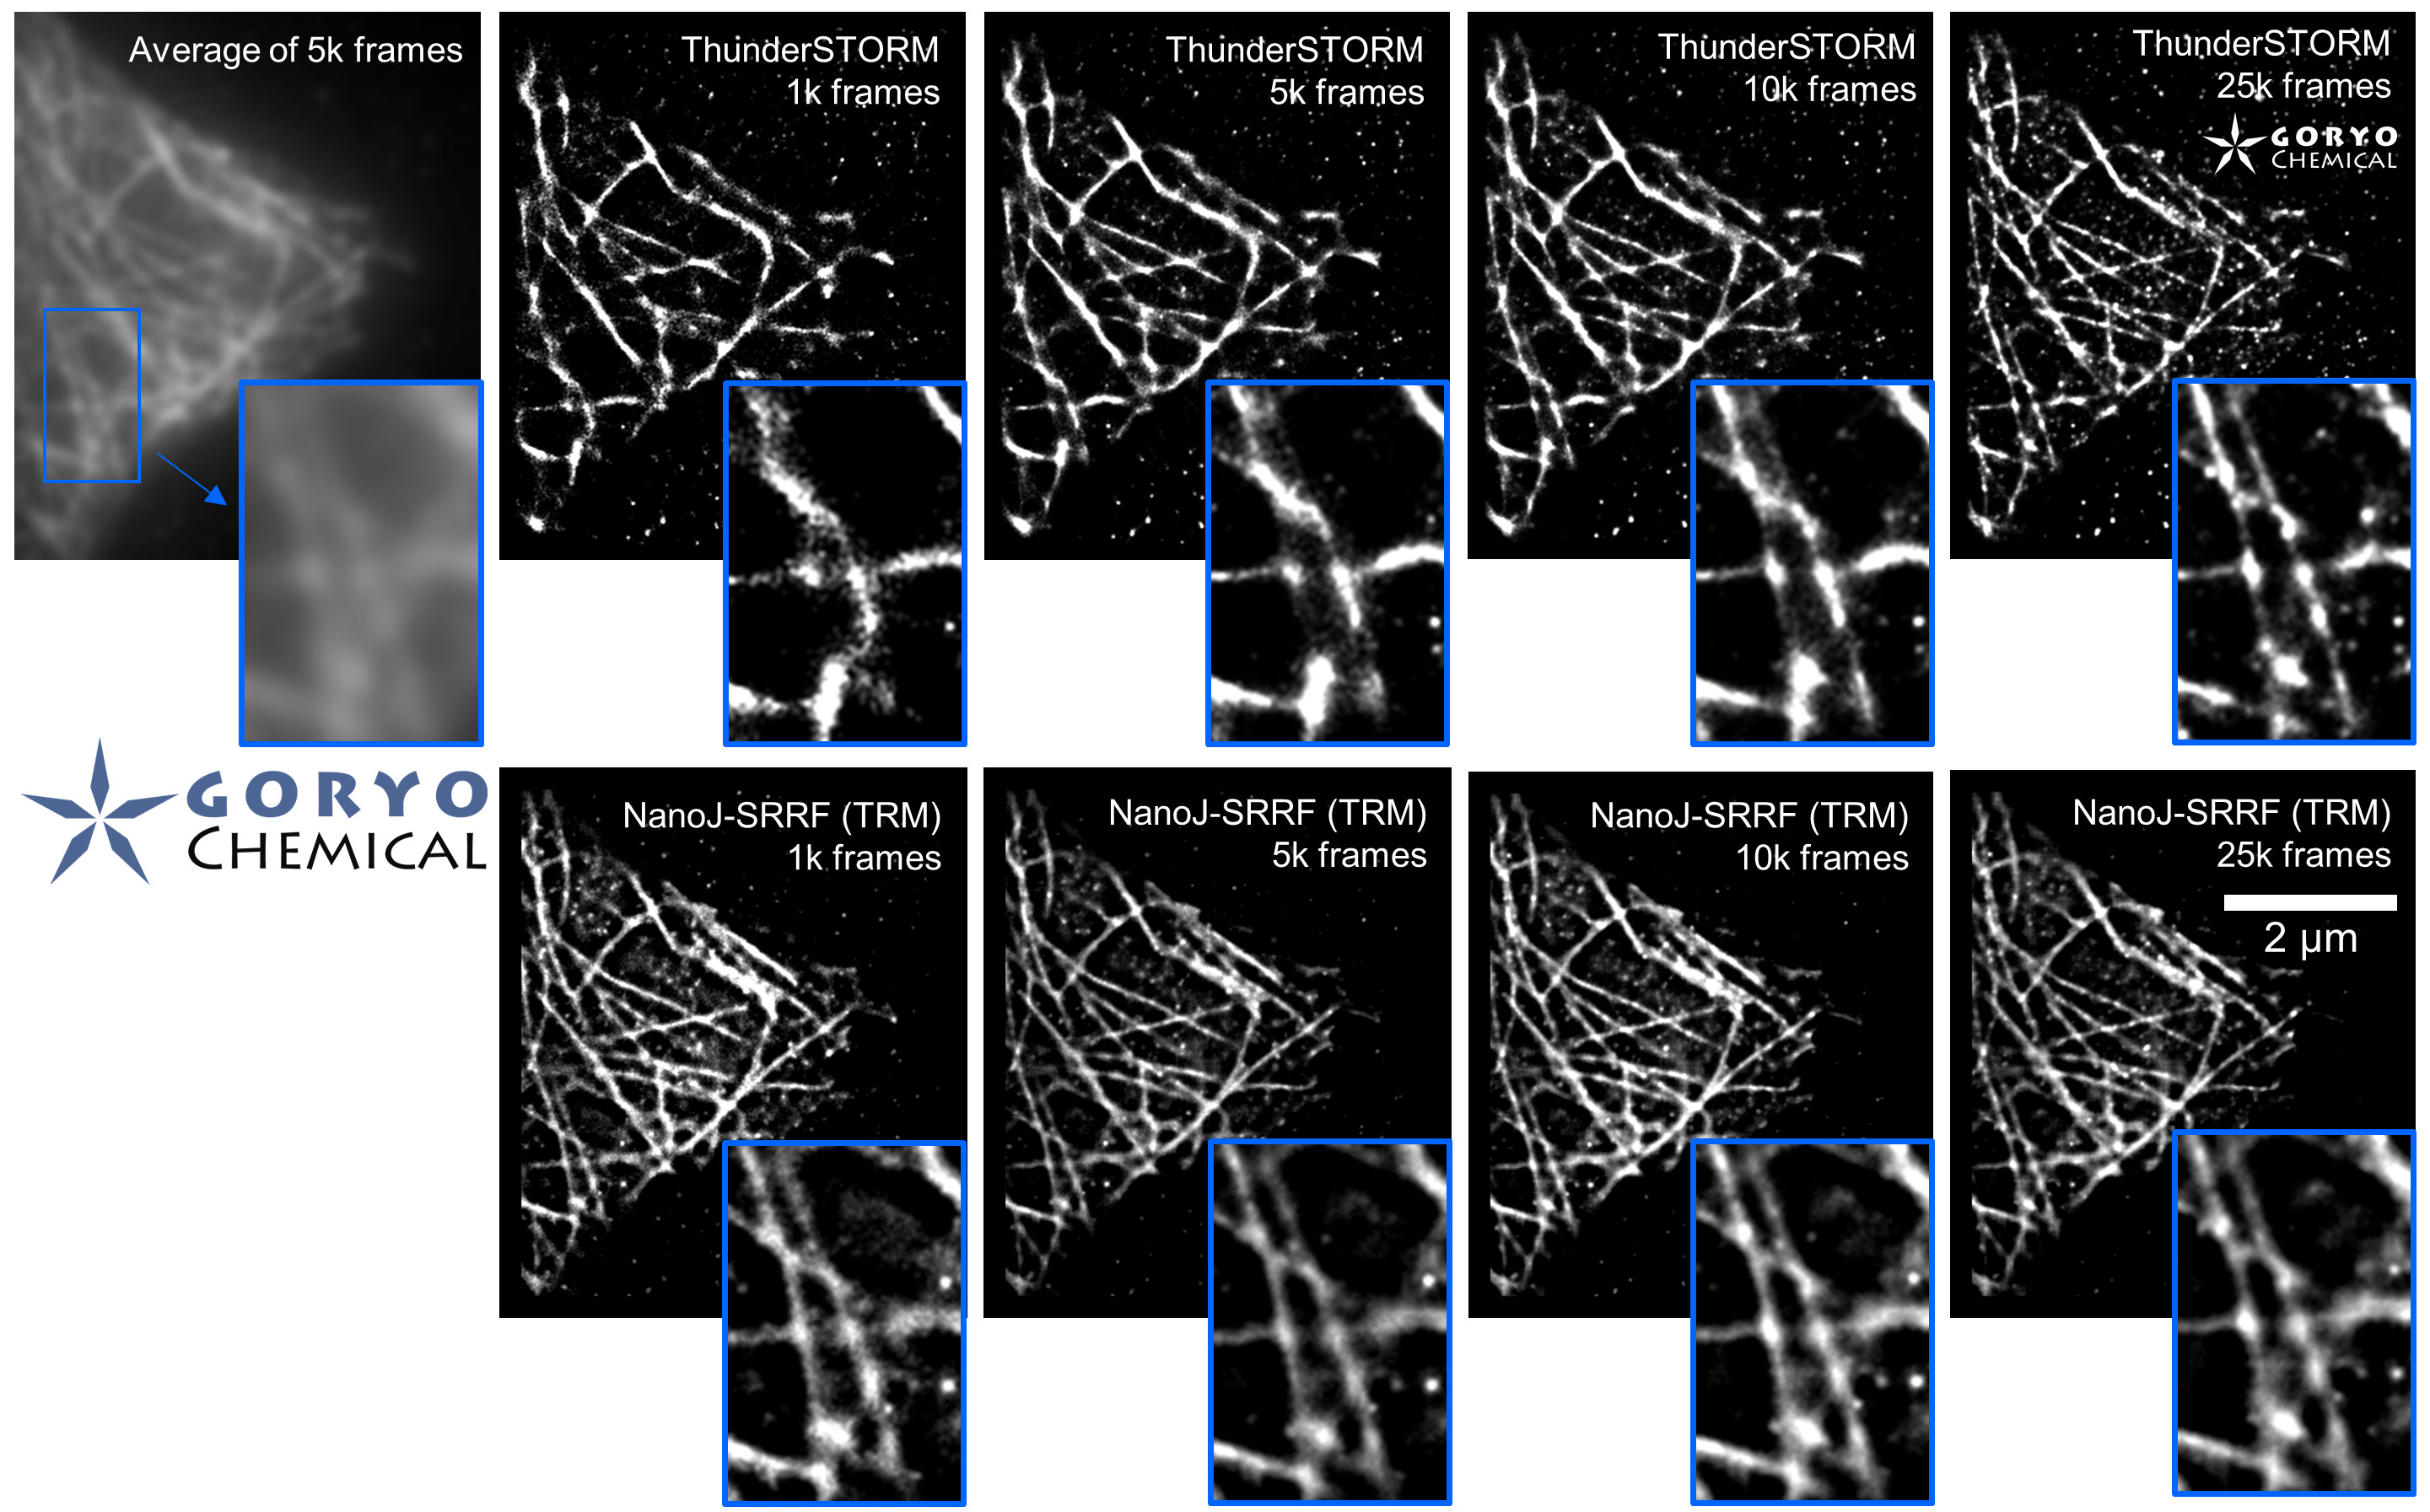
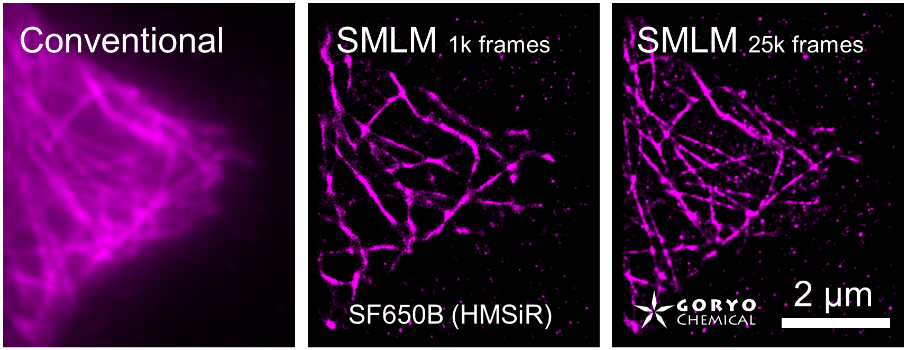
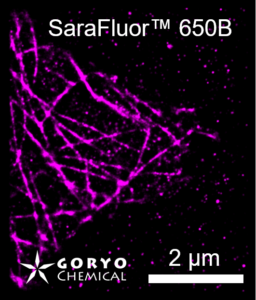
    Fixed HeLa cells were reacted with anti-α tubulin antibody  (DM1A, 1/4000) as a primary antibody, and then reacted with SaraFluor™ 650B goat anti-mouse IgG (A202-01, 30 μg/mL)  as a secondary antibody. The cells were observed with NIKON N-STORM system by TIRF illumination using 647-nm laser, 100x Apo TIRF (NA 1.49) lens . Exposure was 30 msec/frame. Images were analyzed by the each softwares.

    By using ThunderSTORM, 1,000 images were not enough to image some of the microtubule structures, whereas 10,000 images seems to be enough to image most of the microtubules.  NanoJ SRRF (TRM) shows more information for fewer image numbers. ThunderSTORM provided higher contrast, whereas NanoJ SRRF did not give higher contrast and higher resolution even when using >10,000 images.


    References

    M. Ovesný, P. Křížek, J. Borkovec, Z. Švindrych, G. M. Hagen. (2014) Bioinformatics 30:2389-2390 DOI: 10.1093/bioinformatics/btu202 (ThunderSTORM)

    Nils Gustafsson, Siân Culley, George Ashdown, Dylan M. Owen, Pedro Matos Pereira, & Ricardo Henriques (2016) Nature Communications 7: 12471  DOI: 10.1038/ncomms12471 (NanoJ SRRF)


    Acknowlegements

    We appreciate Dr. Kentaro Kobayashi and Dr. Motosuke Tsutsumi (NIKON Imaging Center, Hokkaido Univ.) for advices on imaging and analysis.


FAQ

  • Q SaraFluor 650B-NHS cannot be dissolved with DMSO completely. How should I do?
    A

    SaraFluor 650B-NHS and SaraFluor 488B-NHS show relatively low solubility to water/DMSO. Mix well in DMSO and use it for labeling proteins, according to the protocol. These compounds could assemble each other in an aqueous/DMSO solution to show low fluorescence intensity. After labeling proteins, the solubility increases and shows strong fluorescence.


  • Q How can I prepare 0.1 M sodium bicarbonate buffer? Why this buffer is required?
    A

    Dissolve sodium bicarbonate (NaHCO3) to pure water and adjust the concentration to be 0.1 M. The pH should be in the range of 8.0 to 8.4. Alternatively, you can adjust pH by adding a small amount of Na2CO3  or  HCl.

    The reason to recommend this buffer is that the reaction of NHS ester and primary amines is more efficient at alkaline pH. Instead, you can use other alkaline buffers such as HEPES/phosphate/borate buffers.  Avoid to use Tris buffer because it has primary amines and inhibit the reaction of NHS with the target molecules.

  • Q How can I get molar extinction coefficient of a protein at 280 nm?
    A

    Molar extinction coefficient of protein at 280 nm can be calculated by the methods of Gill and von Hippel (1989) Analytical Biochemistry, 182: 319-326  and Anthis and Clore (2013) Protein Science 22:851-858.

    You may find Web services to obtain them in the following sites. Goryo Chemical do not support the usage of these sites and use them according to the Terms and Conditions in each sites.

    http://protcalc.sourceforge.net/
    http://web.expasy.org/protparam/
    http://nickanthis.com/tools/a205.html

  • Q Tell me the efficient labeling method using NHS reagent.
    A

    Prepare purified antibody (or other proteins). If you intended to crude protein sample, we recommend to purify protein using either affinity column, ultrafilteration or gel filteration before the labeling to increase labeling efficiency. In addition, avoid to use Tris-buffer, because Tris has primary amine and it strongly inhibit the reaction of NHS to the target protein.

    In some cases, reaction at 4oC for overnight gives higher degree of labeling compared with reaction at 37oC for 1 hour.

  • Q My question is not in this FAQ list.....

Reference

YR. Chowdhury, A. Sau S. M. Musser (2022)
Nat. Cell. Biol. 24: pages112–122 DOI: 10.1038/s41556-021-00815-6   (SF650B)

A. Morozumi, M. Kamiya, Y. Urano (2020)
Neuromethods 154: 203-227 DOI: 10.1007/978-1-0716-0532-5_10  (SF488B, SF650B, Halo-SF650B)

S. Uno, M. Kamiya, A. Morozumi, Y. Urano (2018)
Chem. Commun. 54:102-105 DOI: 10.1039/c7cc07783a  (SF488B, SF650B)

F-C. Chien, C-Y, Linb, G. Abrigo (2018)
Phys. Chem. Chem. Phys. 20:27245-27255 DOI:10.1039/C8CP02942C (SF650B)

M. Ovesný, P. Křížek, J. Borkovec, Z. Švindrych, G. M. Hagen. (2014)
Bioinformatics 30:2389-2390 DOI: 10.1093/bioinformatics/btu202 (ThunderSTORM)

S. Uno, M. Kamiya, T. Yoshihara, K. Sugawara, K. Okabe, M. C. Tarhan, H. Fujita, T. Funatsu, Y. Okada, S. Tobita, Y. Urano (2014)
Nat. Chem. 6:681-689 DOI: 10.1038/NCHEM.2002 (SF650B)

※論文では SaraFluor 488B と SaraFluor 650B はそれぞれ、HEtetTFER と HMSiR と記載されている場合があります。