MetalloFluor™ Series

FerroOrange

[Labile ferrous ion detecting probe]

570-590 nm:Orange

FerroOrange is an orange fluorescent probe that specifically detects labile iron (II) ions (Fe2+) only. The intensity of fluorescence does not increase in the presence of iron (III) ions (Fe3+) or bivalent metal ions other than iron. It also does not react to chelated iron in ferritin and other substances. FerroOrange is suitable for live-cell imaging because it is highly cell-permeable and has low cell toxicity.
This probe does not have chelating effect.


We are grateful to Dr. Hideko Nagasawa and Dr. Tasuku Hirayama (Gifu Pharmaceutical University) with their support and advices for the commercialization of FerroOrange.


Available through Merck KGaA (Darmstadt, Germany) as:
SCT210-5×35nmol  BioTracker FerroOrange Live Cell Dye
SCT210-35nmol       BioTracker FerroOrange Live Cell Dye


Products

Code No. Product Name Size Merck CAT No. Merck ( Millipore / Sigma Aldrich )
Product Name
GC904-01 FerroOrange 35 nmol × 5 SCT210-175nmol BioTracker FerroOrange Live Cell Dye
GC904-02 FerroOrange 35 nmol × 1 SCT210- 35nmol BioTracker FerroOrange Live Cell Dye
  • Product Information

    Print

    Properties of FerroOrange

    Product Name
    target cell permeability
    reaction Absmax (nm) FLmax (nm)
    FerroOrange Fe2+ yes irreversible 542 572


    Spectra


    Absorption (left) and fluorescent (right) spectra of FerroOrange. Due to reaction with Fe2+, the fluorescence intensity greatly increases.


    Specificity


    Reactivity of FerroOrange to various metal ions, reactive oxygen species, or reducing reagents. Relative fluorescent intensities compared to that when reacted with Fe2+ are shown. FerroOrange shows strong fluorescence increases only when reacted with Fe2+.

    Measurement condition
    • left: 2 μM of FerroOrange was dissolved to 0.05 M HBSS buffer (pH 7.4, containing 0.1 % DMSO as a cosolvent)  was supplemented with each metal ions (1 mM for Na+, K+, Mg2+, Ca2+, or 20 μM for other ions). Fluorescence intensity was measured after the reaction at 37℃ for 60 minutes reaction.
    • right: 2 μM of FerroOrange was dissolved to 0.05 M HBSS buffer (pH 7.4, containing 0.1 % DMSO as a cosolvent)  was supplemented with reactive oxygen species or reducing reagents described below. Fluorescence intensity was measured after the reaction at 37℃ for 60 minutes reaction.
    • Fluorescence intensity of 575 nm was measured with an excitation wavelength of 530 nm, using HITACHI F-2700 Spectrophotometer.
    Conditions for generating reactive oxygen species and adding reducing reagents
    • O2 : 100 µM KO2H2O2 : 100 µM H2O2
    • OH : 200 µM H2O2 and 20 µM FeSO4
    • OCl- : 100 µM NaOCl
    • NO : 100 µM NOC-12 in 0.1N NaOH
    • Fe2+: 20 µM FeSO4
    • Glutathione (GSH) : 1 mM
    • Ascorbic acid (V.C) : 1 mM
    • Ctrl (control): 50 µM HEPES buffer のみ


    Reactivity

    Reactivity of 2 μM of FerroOrange to various concentrations of Fe(SO4)2(NH4)2. It shows linear fluorescence increase to about 5 times concentrations of Fe2+.

    2 μM of FerroOrange was dissolved to 0.05 M HBSS buffer (pH 7.4, containing 0.1 % DMSO as a cosolvent)  was supplemented with each concentrations of Fe(SO4)2(NH4)2. Fluorescence intensities at 575 nm was measured after the reaction at 37℃ for 60 minutes reaction, using a microplatereader (TECAN infinite M200 Pro, excitation at 530 nm).


    Cytotoxicity of FerroOrange

    Cytotoxicity was not detected in 100 times concentration of usual use (100 μM).


    Metabolic activity of HepG2 cells in various concentrations of FerroOrange. FerroOrange of each concentrations (with 1% DMSO as cosolvent) was added and the metabolic activity of cells were measured by MTT assay after 24 hours culture (n = 3, error bar indicates standard deviation).

  • Cell imaging examples using FerroOrange

    Print

    Cell imaging examples using FerroOrange

    Different fluorescence intensities depending on the Fe2+ concentrations

    FerroOrange is a fluorescent probe which fluoresces upon the reaction with labile Fe2+. It is often used to detect intracellular labile Fe2+. Here we demonstrate an imaging example of HepG2 cells. Left panel indicates the physiological level of intracellular Fe2+. Center panel indicates the increased Fe2+ to which Fe2+ was overloaded by adding to the culture medium. When Fe2+ chelator was added (right), intracellular Fe2+ level was greatly decreased.

    HepG2 cells were cultured in HBSS containing 1 μM of FerroOrange for 1 hour to load the reagent and observed by a fluorescent microscope. For +Fe2+, cells were precultured in HBSS containing 100 μM of Fe(SO4)2(NH4)2 for 30 minutres, rinsed with HBSS and then, FerroOrange was loaded. For +Bpy,  1 mM of 2,2′-bipyridyl was added with FerroOrange to chelate Fe2+. For fluorescence observation, a filter set of excitation wavelength of 530-560 nm and emission wavelength of 570-650 nm was used.


    Intracellular localization

    Fluorescence signal of FerroOrange mainly localizes in endoplasmic reticurrum.

    FerroOrange (red), ER Tracker (green), and Hoechist 3342 (blue) were loaded to HT-1080 cells and observed. FerroOrange localizes mainly in endoplasmic reticurrum. Bar indicates 10 μm. Cell line distributed by JCRB Cell Bank was used.


    Comparison of FerroOrange and FeRhoNox-1

    HepG2 cells were reacted with these two probes to detect the physiological level of Fe2+, in order to compare the sensitivity of these probes.

    HepG2 cells cultured in HBSS containing either 5 µM FeRhoNox-1 (left) or 1 µM FerroOrange (right) for 1 hour and observed by fluorescent microscopy. Equivalent observation conditions including excitation light intensity, gain, and fluorescent filters were used. The photos indicate that 1 µM FerroOrange is more sensitive compared with 5 µM FeRhoNox-1, for detecting physiological low concentrations of Fe2+.

  • A timecourse of ferroptosis observed by fluorescence live cell imaging using FerroOrange and ROSFluor series

    Print

    A timecourse of ferroptosis observed by fluorescence live cell imaging using FerroOrange and ROSFluor series

    Ferroptosis is a cell death which depends on intracellular labile Fe2+. Its mechanism is known as a distinct from that of apoptosis or necrosis. Excess amount of intracellular labile Fe2+ induces generation of reactive oxigen species (ROS) and lipid peroxidation, those lead to cell death. It has also been revealed that ferroptosis is induced in some neurodegerative diseases, and some tumor cells are ferroptosis resistant.

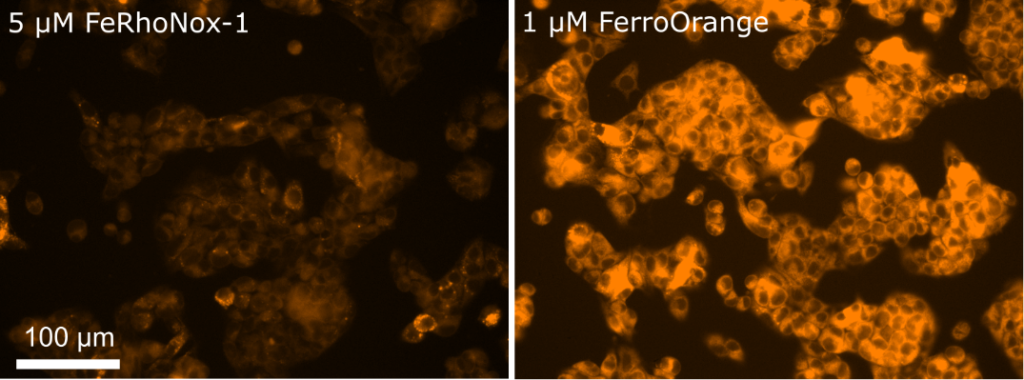
    Here, we tried to detect labile Fe2+ that induces ferroptosis, as well as ROS, by using activatable fluorescent probes of FerroOrange, APF, OxiORANGEand HYDROP, in the timecourse of ferroptosis.

    Visualization of Fe2+ and ROS in the process of ferroptosis

    Erastin was applied to HT-1080 cells to induce ferroptosis, and intracellular labile Fe2+ and ROS were imaged after 3, 6, 9 hours after the application, using the fluorescent probes. FerroOrange (1 μM),  APF (5 μM), HYDROP (1 μM), and OxiORANGE (1 μM) were applied  30 minutes before each of the observation timepoint. Fluorescence signal of FerroOrange which indicates labile Fe2+ was maximum at 3 hours after the induction, whereas fluorescence of other ROS probes: APF which detects hydroxyradical (·OH), hypochlorous acid (HClO), and peroxinitrite (ONOO), OxiORANGE which detects hydroxyradical (·OH), hypochlorous acid (HClO), and HYDROP which specifically detects hydrogen peroxide H2O2 were maximum at 6 hours after the induction. These results indicate that in ferroptosis, ROS increase after the increase in labile Fe2+.

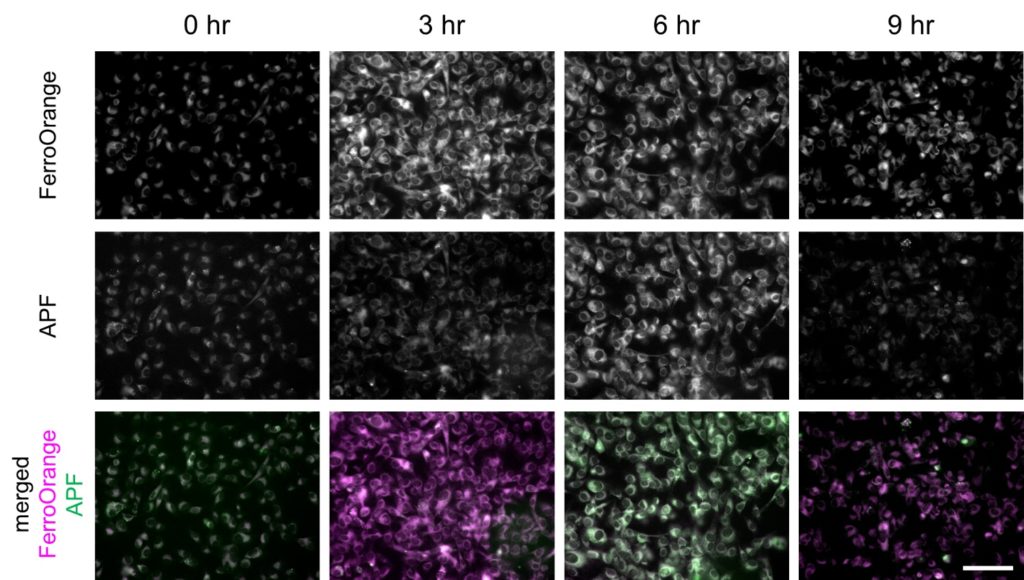
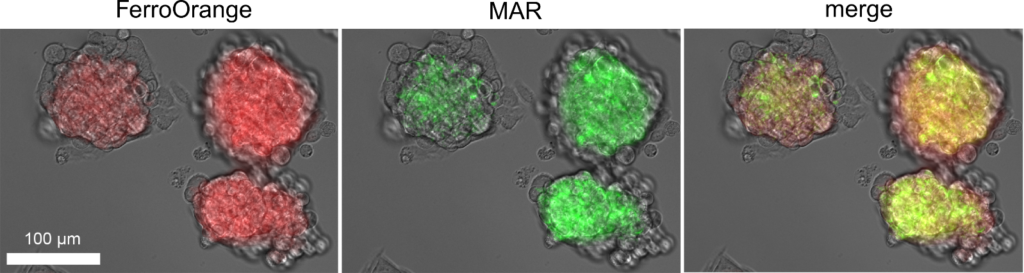
    Fluorescence intensity changes of FerroOrange and APF in ferroptosis-induced HT-1080 cells

    Fluorescence intensity of FerroOrange and APF in erastin-applied HT-1080 cells (upper and middle rows) were shown. Images were overlayed as pseudocolor images (bottom). Magenta indicates fluorescence of FerroOrange, green indicates that of APF. Bar indicates 100 µm.

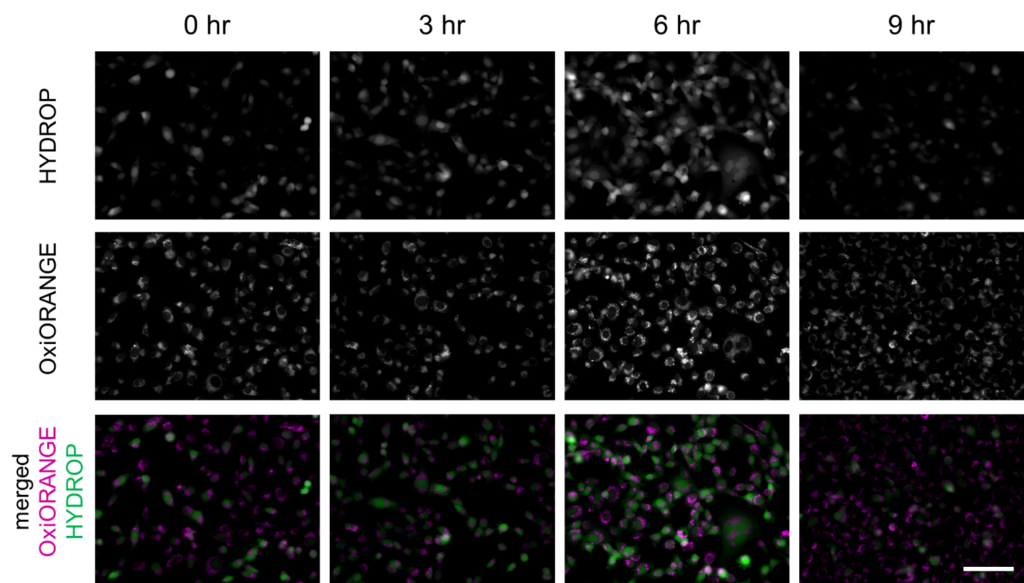
    Fluorescence intensity changes of OxiORANGE and HYDROP in ferroptosis-induced HT-1080 cells

    Fluorescence intensity of OxiOrange and HYDROP in erastin-applied HT-1080 cells (upper and middle rows) were shown. Images were overlayed as pseudocolor images (bottom). Magenta indicates fluorescence of OxiOrange, green indicates that of HYDROP. Bar indicates 100 µm.


    Experiment procedure

    1. HT-1080 cells of 2 × 10⁵ were seeded on glass bottom dishes and cultured until the cells attached to the bottom.
    2. Erastin (final concentration of 30 μM) was added to the media and cultured for2.5, 5.5, 8.5 hours at 37℃, 5% CO2.
    3. Each probes were added to the media and cultured for 30 minutes.
    4. The cells were rinsed twice with HBSS and observed by fluorescence microscopy.

    ※In different cell culture conditions, the concentrations of the reagents and incubation time might be varied. In this experiment, preliminary tests were needed to optimize those conditions.
    ※If the cell adhesion to the dishes was weak, we recommend to use poly-L-lysine coated dished.

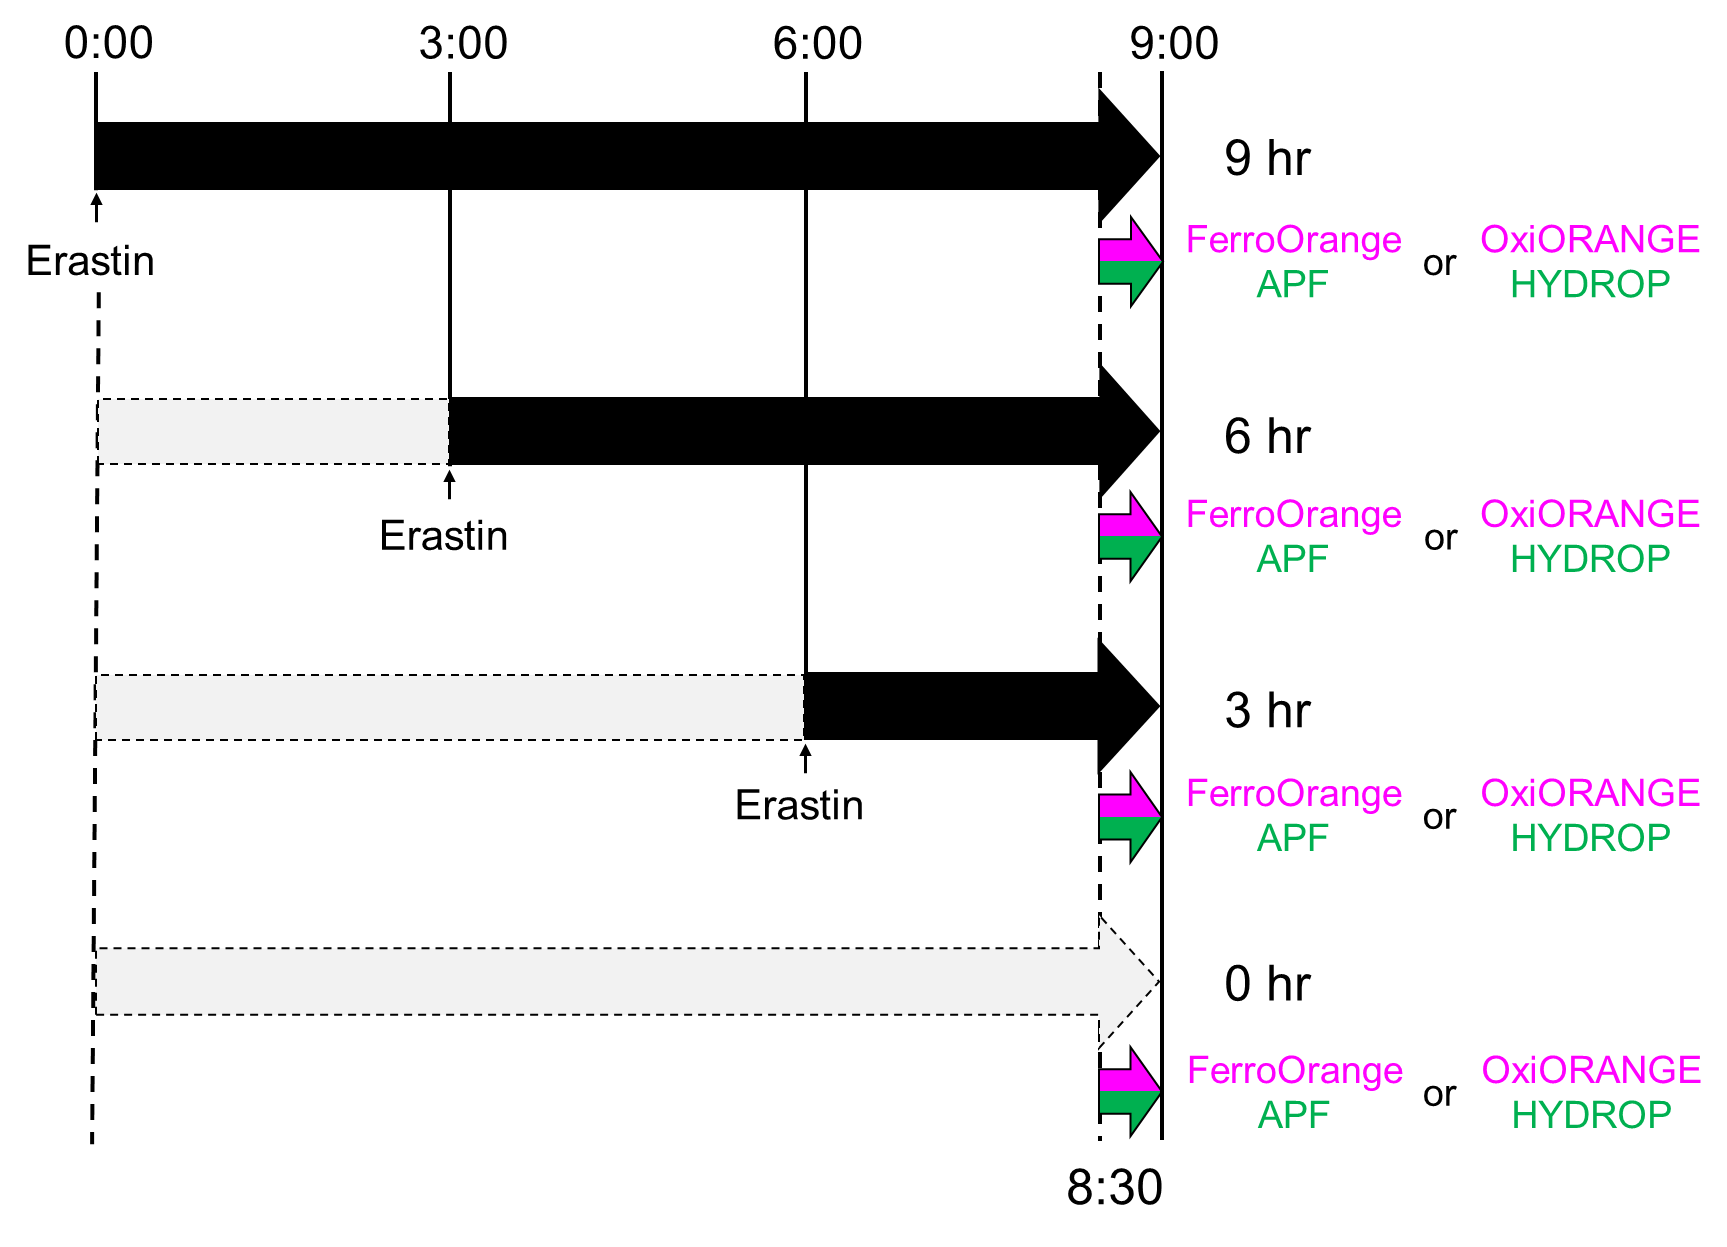
    Actual timecourse of the experiment. Actually, erastin was added in different timepoints and addition of fluorescent probes and observations were performed simultaneously. Since these probes reacts with each target and fluoresces irreversibly, timecourse of ferroptosis was observed by the above procedure.


  • Hypoxia imaging in spheroid using FerroOrange and MAR

    Print

    Hypoxia imaging in spheroid using FerroOrange and MAR

    It has been reported that in a decreased oxygen partial pressure condition (hypoxia), intracellular labile Fe2+ increases compared to that in a normoxia conditions  (T. Hirayama et al., 2017, Chem. Sci. 8: 4858-4866). Here we observed hypoxia and intracellular labile Fe2+ increase using fluorescent probes, FerroOrange and MAR, simultaneously.


    To spheroids of HepG2 cells, MAR (final 1 μM) was applied and cultured for 4 hours at 37℃, 5% CO2. Furthermore, FerroOrange (final 1 µM) was also applied and cultured for 30 minutes. Strong fluorescence derived from FerroOrange was observed in the center region of spheroids (left, red). Fluorescence of MAR (center, green) was also detected in the central regions. Overlayed image (right) indicates that the both area are almost overlapped, indicating that cellular hypoxic response and increase in labile Fe2+ occurs in the almost same regions.

    Experiment procedure

    1. Spheroid of HepG2 cells were formed using cell culture dishes to which cells do not adhere. Alternatively, commercially available spheroid-forming kits can be also used. Refer the manufacture’s instructions for the procedure.
    2. Carefully transfered the spheloids to glass-bottomed dishes, and cultured for ~1 days to let the spheloids adhere to the dish.
    3. Added MAR to the medium (final 1 μM) and cultured for 4 hours at 37℃, 5% CO2.
    4. Added FerroOrange to the medium (final 1 μM) and cultured for 30 minutes at 37℃, 5% CO2.
    5. Carefully rinsed spheloids with HBSS twice, not to removing spheloids from the bottom, and observed by fluorescence microscopy.

FAQ

  • Q Does the probe only detects Fe2+ in Golgi/ER?
    A

    The probes are known to be localized either in Golgi or in ER, however,  it has been considered that they also detect Fe2+ in the cytoplasmic pool. Please note that the definitive evaluation for this point has not been reported, yet. 

  • Q Can FerroFarRed, FerroOrange be used in fixed samples?
    A

    These reagents could not be used for paraffin slices.

    These reagents could only be used in mild fixation conditions such as 3% paraformaldehyde (PFA) in PBS for 10 min at 4°C.
    The fluorescence intensity of the samples which were fixed for 20 minutes or more, or fixed at room temperature, was significantly decreased compared with unfixed samples.

    Please note that it might be difficult to react these probes with fixed samples. Apply the reagent first, then try fixation.

  • Q Which of the ferrous detecting reagents is the most appropriate for my purpose?
    A

    FerroOrange is the most sensitive probe for ferrous ions. In contrast, FerroFarRed is suitable for flow cytometry with red laser.
    Regarding the number of the publications, FeRhoNox-1 (RhoNox-1) might be the best to reproduce experiments.

    Code Number Product Name Exmax (nm) Emmax (nm) Microscopy Flow cytometry
    (blue laser)
    Flow cytometry
    (red laser)
    Plate reader
    GC901 FeRhoNox-1 540 575
    GC903 FerroFarRed 646 662
    GC904 FerroOrange 542 572

    We recommend to use a green laser (ex. 532 nm) to excite FeRhoNox-1 or FerroOrange.

  • Q My question is not in this FAQ list.....

Reference

H. Tanaka, S. Maeda, K. Nakamura, H. Hashizume, K. Ishikawa, M. Ito, K. Ohno, M. Mizuno, Y. Motooka, Y. Okazaki, S. Toyokuni, H. Kajiyama, F. Kikkawa, M. Hori (2021)
Plasma Process. Polym. in press DOI: 10.1002/ppap.202100056

Y. Ikeda, H. Hamano, Y. Horinouchi, L. Miyamoto, T. Hirayama, H. Nagasawa, T. Tamaki, K. Tsuchiya (2021)
J. Trace Elem. Med. Biol. 67: 126798 DOI: 10.1016/j.jtemb.2021.126798

F. Ito, K. Kato, I. Yanatori, T. Murohara, S. Toyokuni (2021)
Redox Biol. 47: 102174 DOI: 10.1016/j.redox.2021.102174

S. Zhuang, Y. Ma, Y. Zeng, C. Lu, F. Yang, N. Jiang, J. Ge, H. Ju, C. Zhong, J. Wang, J. Zhang  S. Jiang (2021)
Cell Biol. Toxicol. in press DOI: 10.1007/s10565-021-09660-7.

A. Li, C. Liangy, L. Xu, Y. Wang, W. Liu, K. Zhang, J. Liu, J. Shi (2021)
Acta Pharm. Sin. B 11: 1329-1340 DOI: 10.1016/j.apsb.2021.03.017

K. Komoto, T. Nomoto, S. E. Muttaqien, H. Takemoto, M. Matsui, Y. Miura, N. Nishiyama (2021)
Cancer Sci. 112: 410–421 DOI: 10.1111/cas.14607

K. Tomita, T. Nagasawa, Y. Kuwahara, S. Torii, K. Igarashi, M. H. Roudkenar, A. M. Roushandeh, A. Kurimasa, T. Sato (2020)
Int. J. Mol. Sci. 22: 8300-8314 DOI: 10.3390/ijms22158300

T. Hirayama, M. Niwa, S. Hirosawa, H. Nagasawa (2020)
ACS Sens. 5: 2950-2958 DOI: 10.1021/acssensors.0c01445

Y. Takashi, K.Tomita, Y. Kuwahara, M. H. Roudkenar, A. M. Roushandeh,  K. Igarashi, T. Nagasawa, Y. Nishitani, T. Sato (2020)
Free Radic. Biol. Med. 161:60-70 DOI: 10.1016/j.freeradbiomed.2020.09.027

Y. Hirata, K. Kuwabara, M. Takashima, T. Murai (2020)
Chem. Res. Toxicol. 33: 2892–2902

Y. Hirata, Y. Ito, M. Takashima, K. Yagyu, K. Oh-Hashi, H. Suzuki, K. Ono, K. Furuta, M. Sawada (2020)
ACS Chem. Neurosci.  11: 76−85 DOI: 10.1021/acschemneuro.9b00619

K. Tomita, M. Fukumoto, K. Itoh. Y. Kuwahara, K. Igarashi, T. Nagasawa, M. Suzuki, A. Kurimasa, T. Sato (2019) 
Biochem. Biophys. Res. Commun. 518: 712 DOI: 10.1016/j.bbrc.2019.08.117

K. F. Yambire, C. Rostosky, T. Watanabe, D. P. Grau, S. T. Odio, A. S. Guerrero, O. Senderovich, E. G. M. Holtz, I. Milosevic, J. Frahm, A. P. West, N. Raimundo (2019)
Elife 8: e51031 DOI: 10.7554/eLife.51031

M. Takashima, K. Ichihara , Y. Hirata (2019)
Food Chem. Toxicol. 132: 110669 DOI: 10.1016/j.fct.2019.110669

M. Sato, T. Hirayama, T. Fujii, H. Nagasawa, I. Minoura (Jan. 2018)
ASCB | EMBO 2017 Meeting (poster)