SaraFluor™ Structural Imaging Series

SaraFluor™ 497 actin probe

[Actin specific probes]

495-540 nm:Green

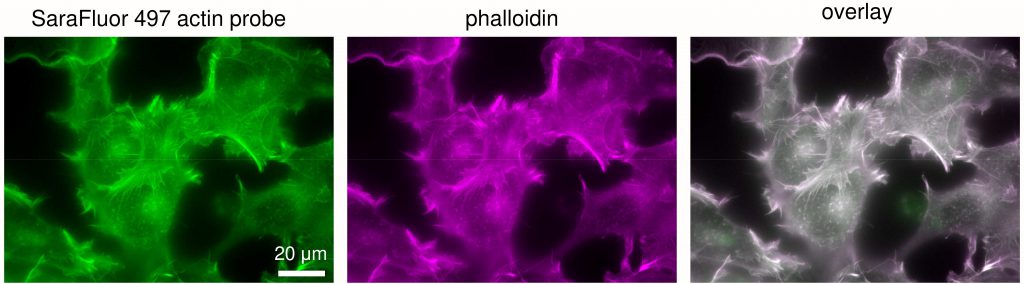
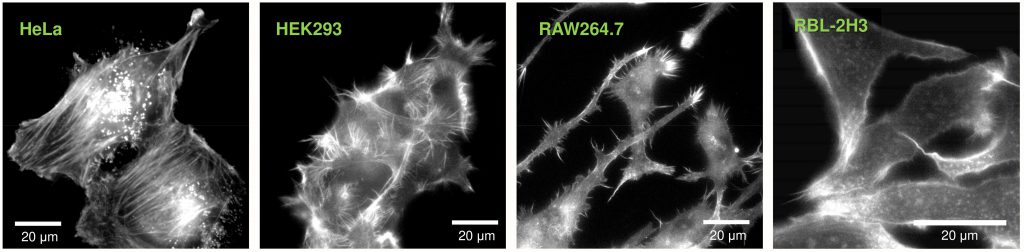
SaraFluor™ 497 actin probe specifically binds F-actin and visualizes actin filaments of living and fixed cells via green fluorescence. F-actin structures can be easily visualized just by adding this reagent to the culture medium or to the buffer solution, without any washing-out steps. This reagent has been considered to share the same binding site with phalloidin and jasplakinolide on actin molecules, however, it can be also applied to live-cell imaging.


Available through Merck KGaA (Darmstadt, Germany) as:
SCT215 BioTracker™ 497 Green Actin Live Cell Probe

Products

Code No. Product Name Size Merck CAT No. Merck ( Millipore / Sigma Aldrich )
Product Name
AR5601-N5 SaraFluor™ 497 actin probe 30 nmol × 5 SCT215 BioTracker™497Green Actin Live Cell Probe

Downloads

  • Protocol

  • SDS

  • Product Information

    Print

    Properties of SaraFluor 497 actin probe

    Name Detection target cell permeability
    Absmax (nm) FLmax (nm) ε Φ
    SaraFluor 497 actin probe F-actin yes 497 519 n.d. 0.78


    Spectra


    Reaction time of SaraFluor 497 actin probe

    In most cases, 10 minutes is enough to stain F-actin, after the addition to the cell culture medium.

    The above example shows the time-course of actin -staining. HeLa cells were observed (excitation 460 – 500 nm, emission 512-542 nm) by adding 100 nM of SaraFluor 497 actin probe to the DMEM medium. 5 minutes after the addition, the increase of the contrast was almost saturated.

    The background signal derived from the unbound prove should be removed by image manipulation. Use the application of your microscope to reduce the image offset, or use image analysis software such as ImageJ. In case of ImageJ, choose menu as Image→Adjust→Brightness/Contrast to open the B&C panel and decrease the Minimum parameter. We do not recommend to change the medium to remove the unbound probe, because medium exchange may also decrease the signal intensities. The actin-bound probes and the probe in the solution form an equilibrium, and therefore, reduction of the probe in the solution causes the reduction of the actin-bound probe.


    Effect on the cell morphology

    This reagent could induce shrinkage of the cells. Therefore use lowest possible concentration or stain cells after fixation if you would like to analyze the exact cell morphology.

    HEK293 cell size change after application of SaraFluor 497 actin probe, analyzed by bright-field images. Relative area of cells or clusters of cells just after the application of this reagent are indicated. Final concentration of DMSO is 0.1%, N = 5. Error bars indicate standard deviation. 10 nM did not induced size changes, whereas 100 nM induces cell shrinkage of about 40% in 15 minutes.

  • Imaging examples using SaraFluor 497 actin probe

    Print

    Double staining with fluorescently labeled phalloidin

    HEK293 cells were fixed and stained with SaraFluor 497 actin probe and fluorescent phalloidin. The two stains were exactly the same.

    HEK293 cells were fixed with 4% paraformaldehyde in PBS(+) at 37oC for 15 min. Cells were permeabilized with 0.5% Triron X-100 for 5 min, stained with 100 nM phalloidin (Acti-stain 555, Cytoskeleton, Inc.) in PBS, then the solution was replaced with PBS supplemented with 100 nM SaraFluor 497 actin probe. Cells were observed with a conventional fluorescence microscope with excitation wavelength of 460-500 nm and emission wavelength of 512-542 nm for  SaraFluor 497 actin probe (shown as green pseudocolor), and excitation wavelength of 530-560 nm and emission wavelength of 572-648 nm (shown as magenta pseudocolor) for fluorescent phalloidin.


    Examples of actin staining in various cell strains.

    Actin structures were successfully stained in the following cell strains: HeLa and HEK293 cells (from human), RAW264.7 cells (from mouse macrophage), RBL-2H3 cells (from rat mast cell).


    Superresolution live imaging

    100 nM of SaraFluor 497 actin probe were added in the culture medium (DMEM + 10% FBS) of HeLa cells. Cells were continuously observed with fluorescence microscopy, and the images were processed with SRRF algorithm.

    Please refer the following paper for SRRF algorithm.

    Gustafsson, N., Culley, S., Ashdown, G. et al. (2016) Fast live-cell conventional fluorophore nanoscopy with ImageJ through super-resolution radial fluctuations. Nat Commun 7, 12471. DOI: 10.1038/ncomms12471

FAQ

  • Q Can SaraFluor 497 actin probe be applied to yeast or plant cells?
    A

    We tried to stain the actin filaments of budding yeast with this probe, but the result was negative. Although we didn’t measured the affinity of this probe to yeast actin, it could be low. Therefore we do not recommend to apply this probe to yeasts at this time.  The application to fungi or plant cells has not been reported, yet.

  • Q Cells detaches from the dish after the addition of SaraFluor 497 actin probe. How can I avoid this?
    A

    Some types of cells shrink or detaches after the addition of SaraFluor 497 actin probe. In that cases, use collagen- or poly-lysine-coated dishes. In some cases, addition of  DMSO causes cell detachment.  Use fresh and high purity DMSO and adjust the final concentration of DMSO to be less than 0.1%.

  • Q I could not find my question in this list, yet.
    A

     Contact us if your question has not been solved.